Chapter 4: Bringing It All Together
GIS is distinguished from cartography by its ability to analyze data.
- Impossible to look at a static map and determine how much population change might have happened in a certain time period

GIS is able to transform map data and customize it if so desired.
GIS is helpful when one wants to know “whether a given spatial entity is contained within an area” by using polygons.
- Schools
- Gas stations
- Zoning laws
- Etc.
“As GIS developed and has been disseminated, its ability to model interactions among spacial phenomena has increased.
“Today GIS is used to query spatial data, analyze spatial relationships, and characterize regions, as well as to model spatial change over time and space.”
Overlay analysis is quite possibly the most common GIS analysis function.
- Allowing for a visual representation of possible commonalities in areas
- Allows relationships to be determined
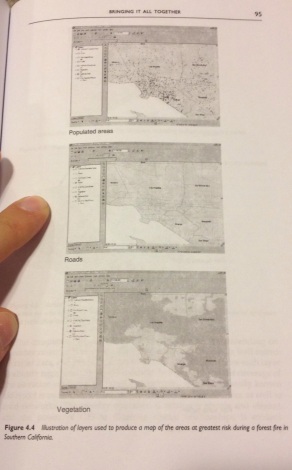
- E.g. overlay analysis can be used to identify populated areas that are “at risk” for fires in Southern California
- Individual layers, such as population, roads, and vegetation, can be taken and basically combined. Also add on fire hazard zones, buffer zones, etc.

Between raster and vector data, overlay is well suited to raster
Set theory
- A mathematical construct on which overlay analysis is based
- Uses the areas or spatial entities that are the basis of GIS to formally express relationships between them
Map algebra
- Set of arithmetical operations that can be performed on raster data
Reclassification of attribute values
One of the most common applications of GIS is to aid in decision making for spatial location
- “Multi-criteria evaluation (MCE) is a raster based modeling tool that allows users to combine several criteria (attributes) in order to derive a suitability index for location of a spatial entity”
- E.g., figuring out out where to build waste treatment plants
Intuition – used by GIS researchers as a means of making sense or interpreting visual displays of geographical data
- TB in Vancouver
- Using spatial analysis techniques to identify clusters, and displaying the patterns

Data and analysis are closely linked
- Especially when it comes to epidemiological and population health studies
– Population health is concerned with the influences that social relations play in shaping the health of individuals and communities.
- The spacial framework you are working with must be flexible since areas of analysis change
Spatial analysis problems
- MAUP – modifiable area unit problem
– A problem that occurs when spatial units, such as postal codes, are categorized into larger units
- Ecological fallacy
– When categorization or scaling introduces a bias when attributing the characteristics of populations or groups to individuals
Problems with using a raster based system

- In converting to raster from vector, data appears almost as blurry or granulated, since there aren’t as much data for specific polygons. When going from vector to raster, the data has to be disaggregated to create a raster coverage.
Health profiles and indices
- Jarman 8 – index developed to to measure underprivilege, initially in the UK to idenitify underprivileged areas for the purposes of health care planning.
